Blog Post 31

May 1- 5

Learning Outcomes

Mathematics 

Demonstrate an understanding of fractions by using concrete, pictorial and symbolic representations to: 

  • create sets of equivalent fractions 
  • compare fractions with like and unlike denominators  

 What Did Students Do?

Students were given a package of Smarties and asked to create a visual journal page to represent their understanding of fractions. They were given 10 Smarties that varied in colours, they had to determine what the fraction for each colour of smarties in their set. They then had to represent these fractions on a number line from 0 to 1 and students had to represent their fractions using a rectangle model. 

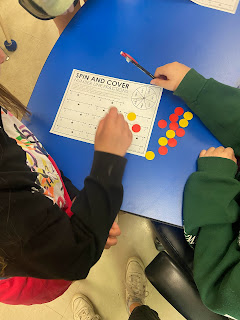
Students then played a game called "Spin and Cover Number Line Fractions." They had to spin to on a spinner to get a unit fraction and mark it on the game sheet, then their partner went and did the same thing, if the fraction was already taken, players lost their turn. Once all the of the number lines were taken, the player with the most covered won! 


Ask Your Child:

- What is a fraction?

- What is the top number of a fraction called?

- What is the bottom number of a fraction called? 

- What does the denominator and numerator represent? 

- Show me a fraction on a number line. 

- When do we use fractions in our everyday life?  


Coming Up 

Friday, May 5th - PD Day

Monday, May 8-12  - Trickster Begins

Thursday, May 11th - Trickster Performances for parents 

                                   5:30 - 6:30 Sampson

                                    7:00 - 8:00 Seppala

Comments

Popular posts from this blog

Blog Post 3 September 12th - 16th We had another great week in grade five. It was our first full week and went by so quickly! Learning Outcomes English Language Arts: Create Original Text Generate ideas to use texts from listening, reading, and viewing experiences as models for producing own oral, print, and other media texts What Did Students Do? The grade five students are organizing and putting on the Terry Fox Run. To do this, they have done a great deal of research about Terry Fox and the "why" behind the run. Students have read books, listened to stories, and watched videos to learn about Terry Fox. With that information, they have taken notes, shared school wide announcements, and created posters. We discussed different ways to share information and students identified talking, signing, writing, pictures, and more as ways to do this. They determined that when sharing information, it needs to be clear and interesting. They then created a target to ensure their posters w...
Blog Post 23 February 21 - 24 This week our classes have been doing different things as Room 8 was at 2School and Room 7 was at school.  We have two separate posts below.   Important dates are below.  Room 7 - Pearson/De Luca Learning Outcomes ELA -identify and develop a plan for gathering information and formulating questions to guide research -write or represent meaning of text in different forms What Did Students Do? -Students selected a historical figure and researched why they are important in Black Canadian History.  They then wrote two paragraphs on interesting facts about them and how they influenced Canadian history.   Family Connections Ask your child: -Who did you choose to research? -What are some interesting facts about your person? -How did they influence Canadian history?  Room 8 - Sampson Learning outcomes:  ELA  – Experience various texts  • experience oral, print and other media texts from a variety of cultural tra...
Blog Post 21 February 6 - 10 This week our classes have been doing different things as Room 7 was at 2School and Room 8 was at school.  We have two separate posts below.   Important dates are below.  Room 8 - Sampson Learning Outcomes Math - Statistics and Probability -Differentiate Between First and Second Hand Data -Construct & Interpret Double Bar Graphs To Draw Conclusions What Did Students Do? -Students worked in groups to create a survey question in order to collect first hand data.  They made a data collection chart on large chart paper and surveyed students to collect their data.  They used tally marks to record the data they collected.  Students then transferred information into their own individual charts in their math books and used their first hand data to create double bar graphs. Their graphs included titles, labels, y axis, x axis, key, numbers, and information collected.   Family Connections Ask your child: -What was your ...